UML Diagrams
📐 System Architecture
EcoGuard — UML Diagrams
Detailed structural and behavioral models representing the EcoGuard system.
🏗️ System Diagrams
These diagrams provide a visual representation of how different components interact and function within the system.
Activity Diagram
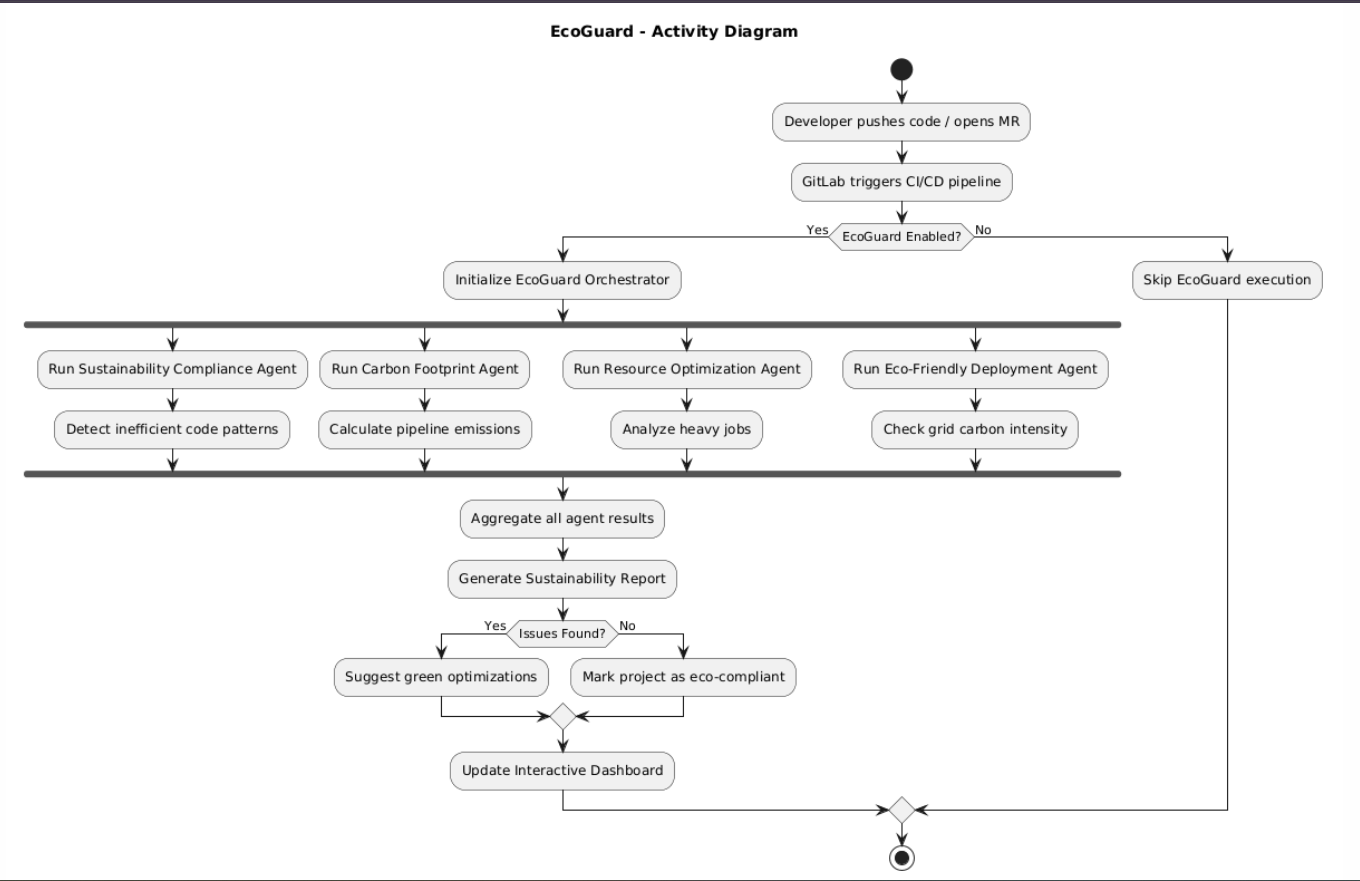
Visualizes the step-by-step workflow of the EcoGuard system, from code push to generating sustainability reports and updating the dashboard.
Sequence Diagram
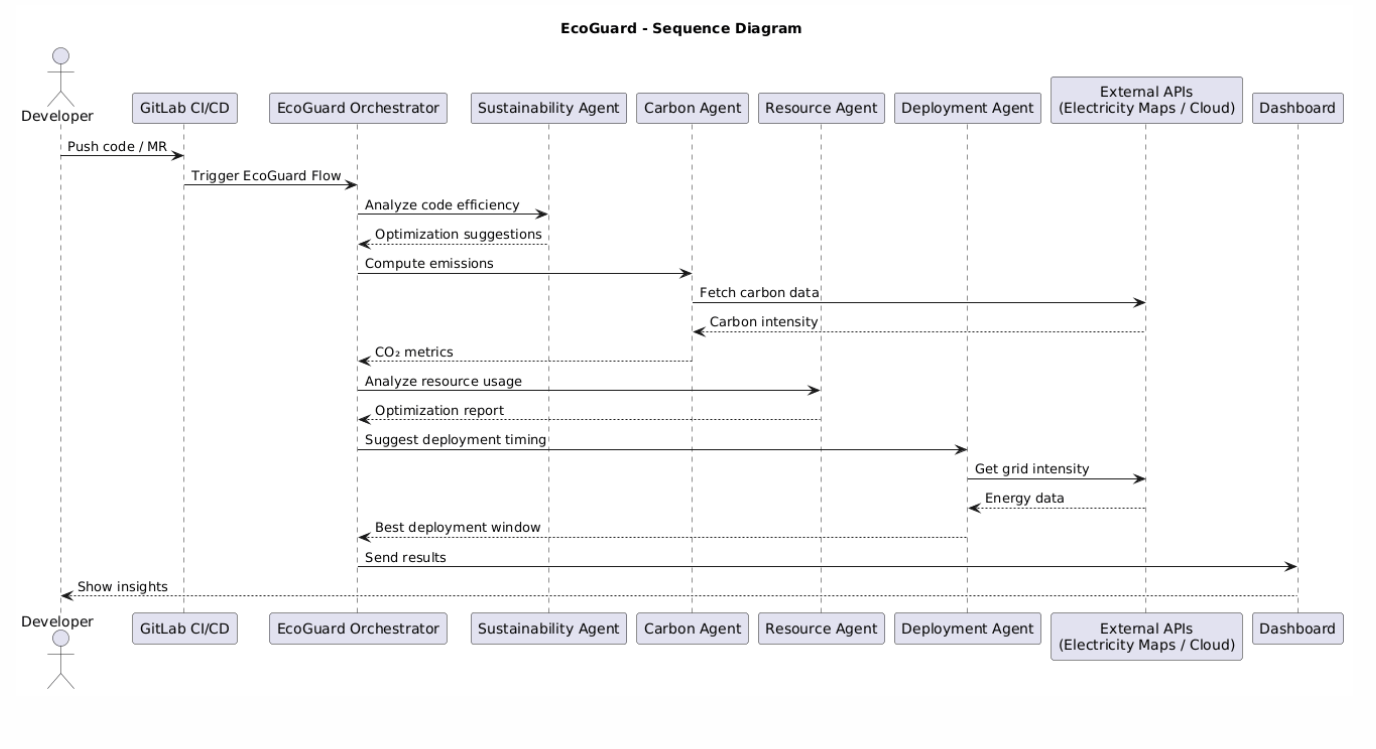
Illustrates the sequence of interactions between the developer, GitLab CI/CD, the EcoGuard orchestrator, and various agents over time.
Collaboration Diagram
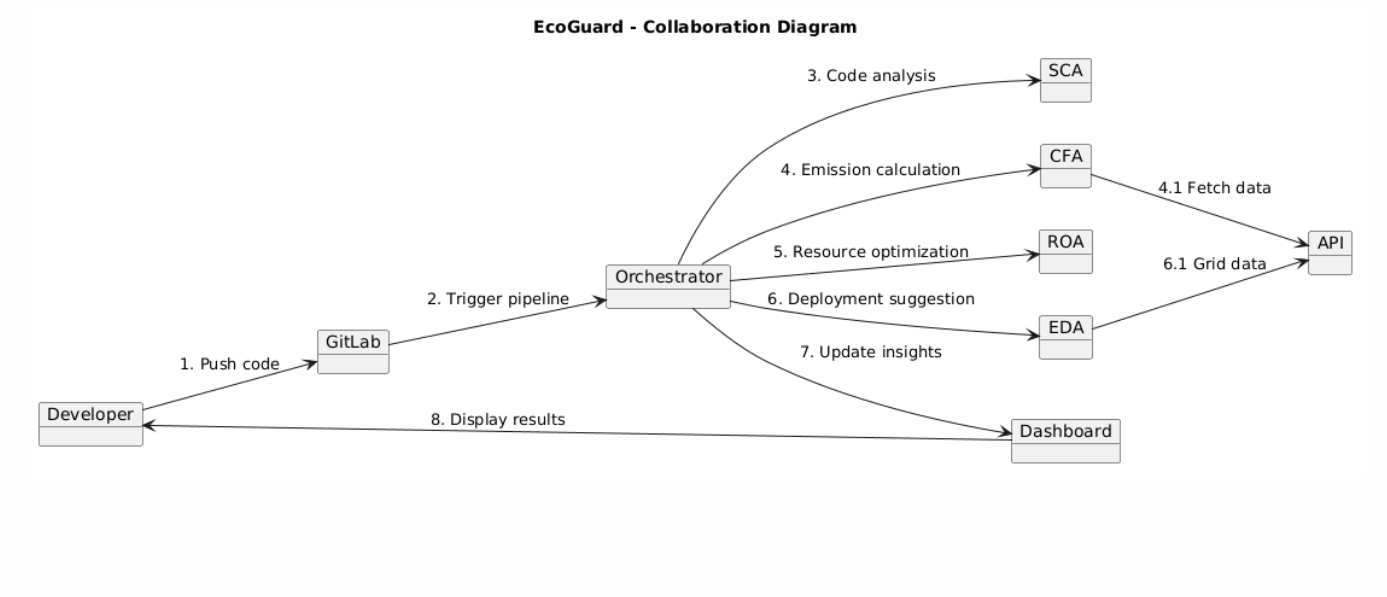
Shows the structural relationships and message flow between system components, emphasizing how they collaborate to achieve optimization goals.
Class Diagram
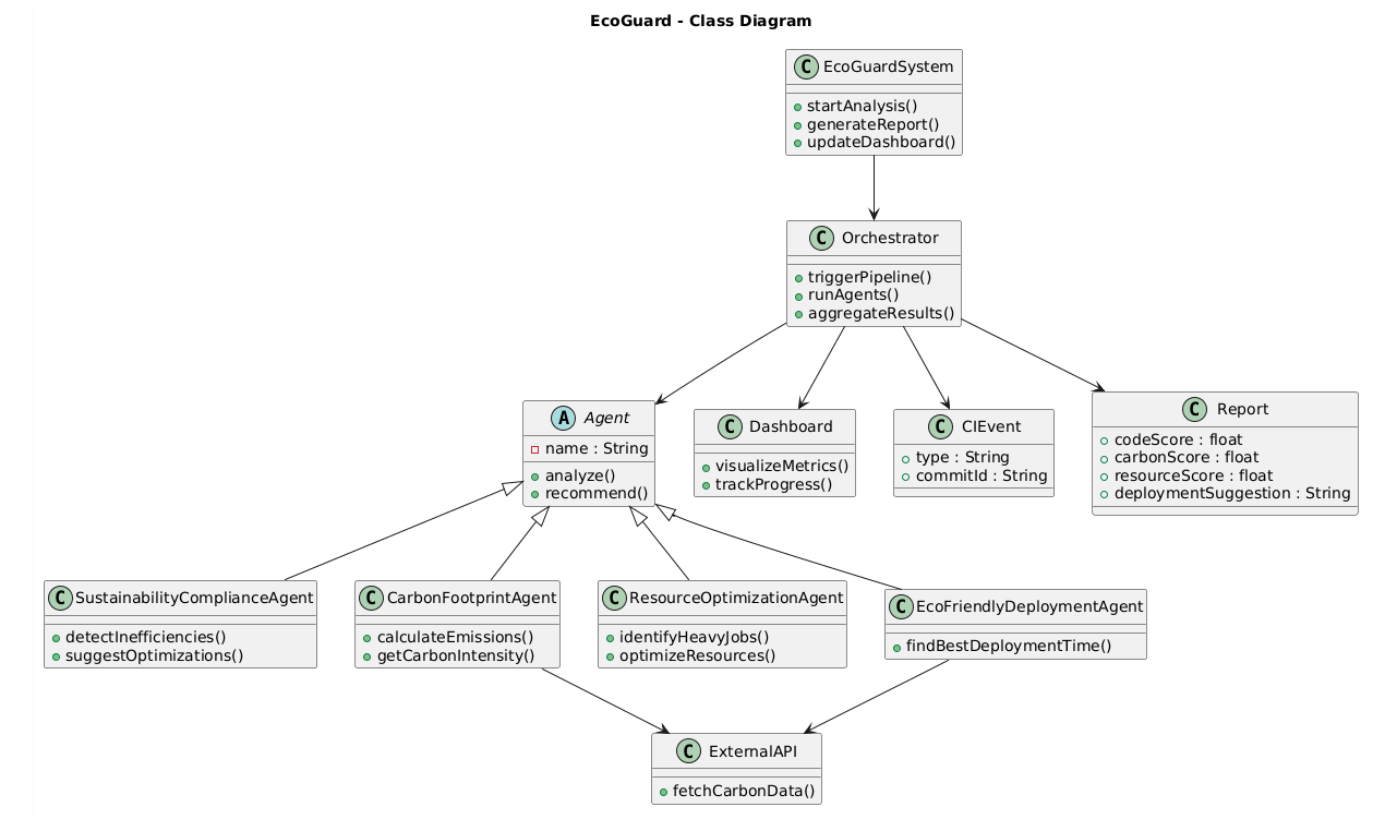
Defines the static structure of the EcoGuard system, detailing the classes, their attributes, methods, and relationships.